A True Graph Analytics Platform
Take full advantage of graph analytics, without building new graph technology competencies in your organization, with DataWalk.
DataWalk is relationship-oriented software that enables graph data analytics at scale through a set of analytic techniques based on how business entities such as people, places, events, and things are related to each other. DataWalk’s knowledge graph foundation uniquely enables you to connect data, understand structures, and identify patterns in large highly-connected datasets through a highly-efficient graph data analysis approach.
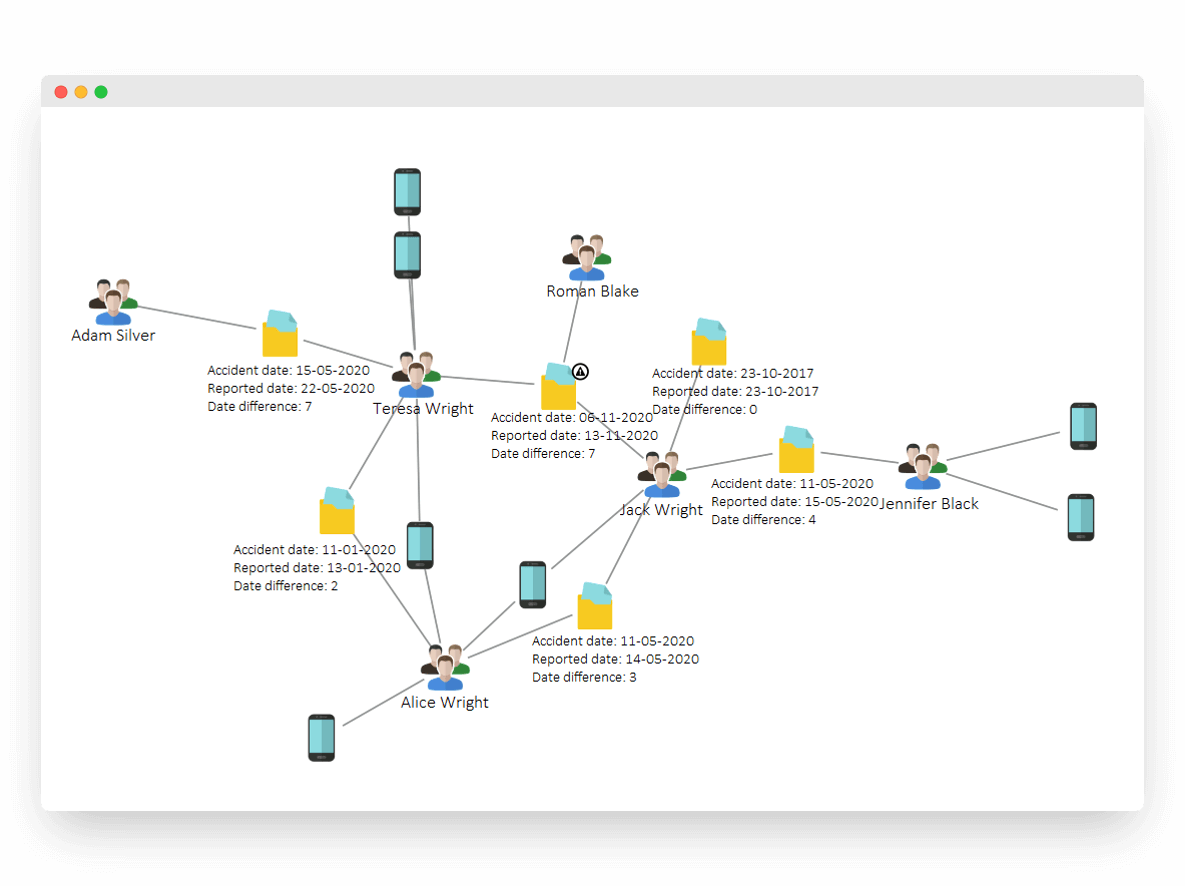
Analyze Data And Relationships
A foundational DataWalk technology is an innovative graph/relational database hybrid. Data and connections are stored, which enables high performance for complex querying and analytics. The graph analysis tool structure enables management and analysis of complex data; the ability to derive value from connections as well as values; analysis of the relationships between individual objects on a link chart, and more efficient processes for machine learning.

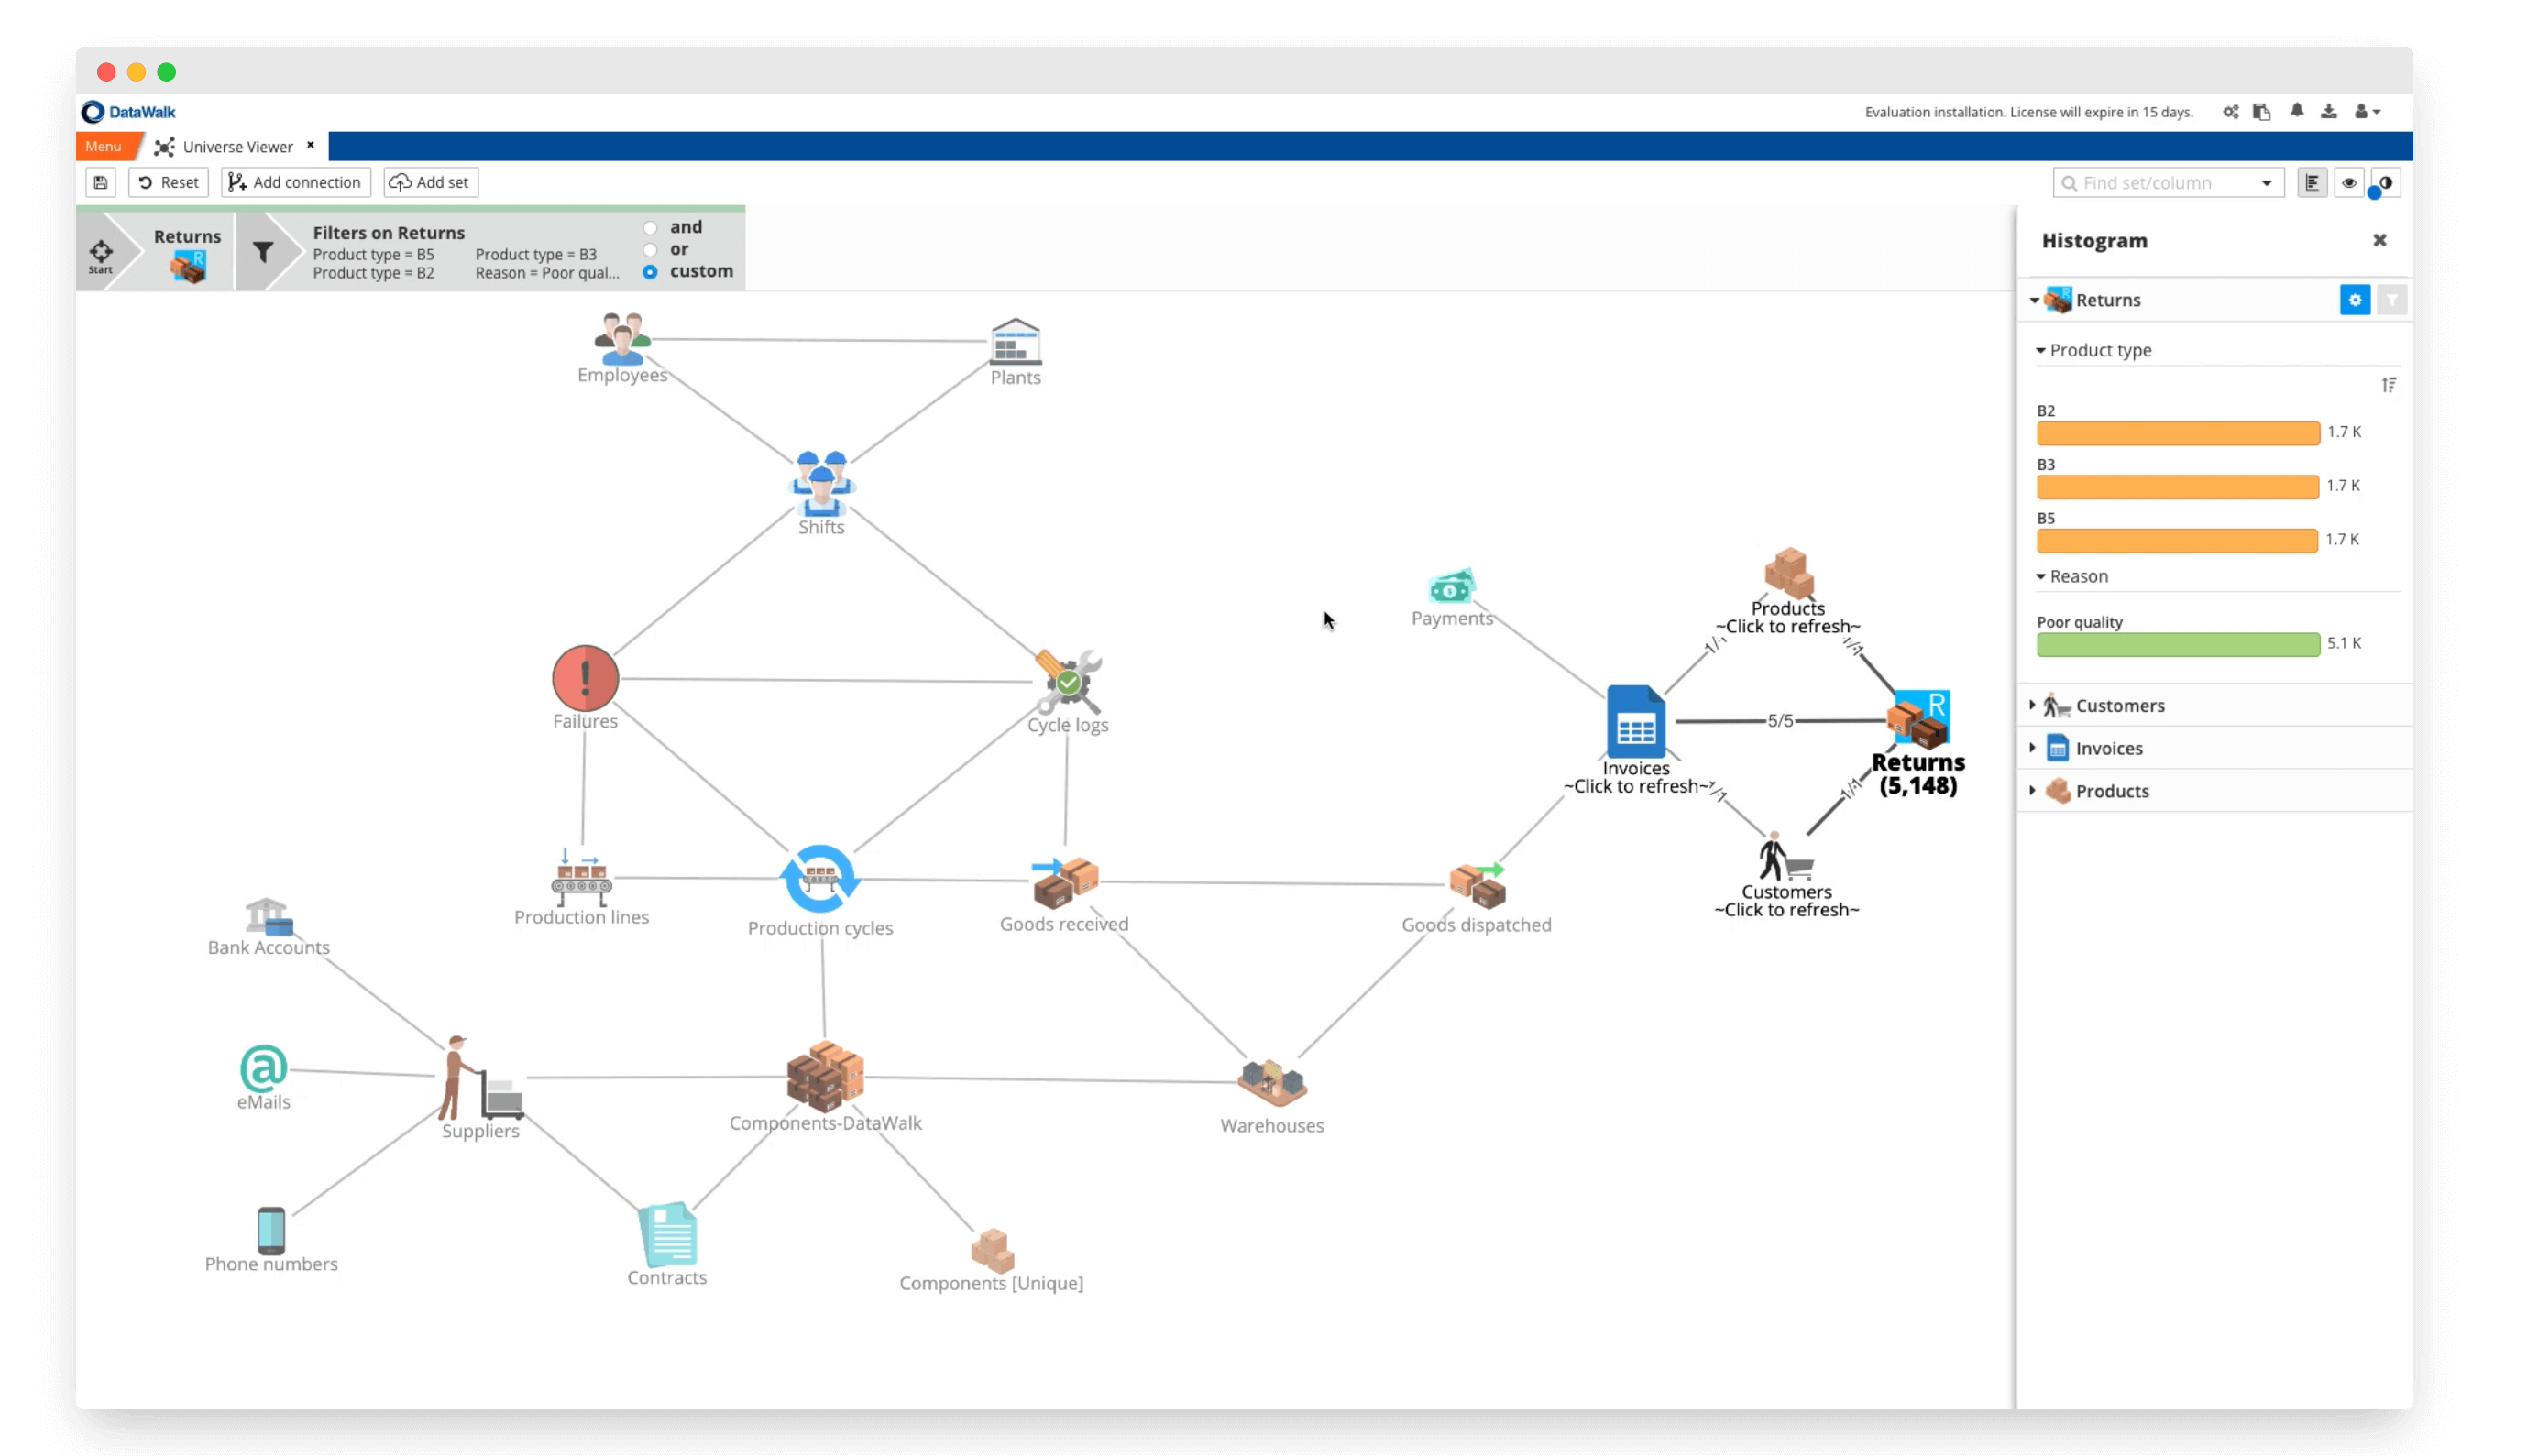
Fuse, Model, And Visualize Your Complex Data Via A Knowledge Graph
The DataWalk Universe Viewer is a knowledge graph that represents all of an organization’s data, and the relationships/connections between that data. The Universe Viewer is designed to support the scale and complexity of enterprise deployments, while organizing data around easily understood business objects. The Universe Viewer embodies a highly flexible logical data model, enabling new data sources and connections to easily be added or modified.
Answer Complex Business Questions Through The Knowledge Graph
Being able to formulate and answer complex business questions is a crucial DataWalk graph analytics capability. DataWalk uniquely meets the challenge for big data query tools, enabling you to quickly generate complex no-code queries that quickly complete, even across vast amounts of data. The knowledge graph query facility enables visual exploration and interaction with graph data structures allowing insights to be found without the need for any query language. Unlike alternative solutions built around joining multiple tables, with the DataWalk knowledge graph you walk through business data sets using persistent and available links. DataWalk leverages advanced graph AI techniques, such as graph embeddings, to enable intuitive interaction with graph data structures, providing actionable insights through an accessible and user-friendly interface.
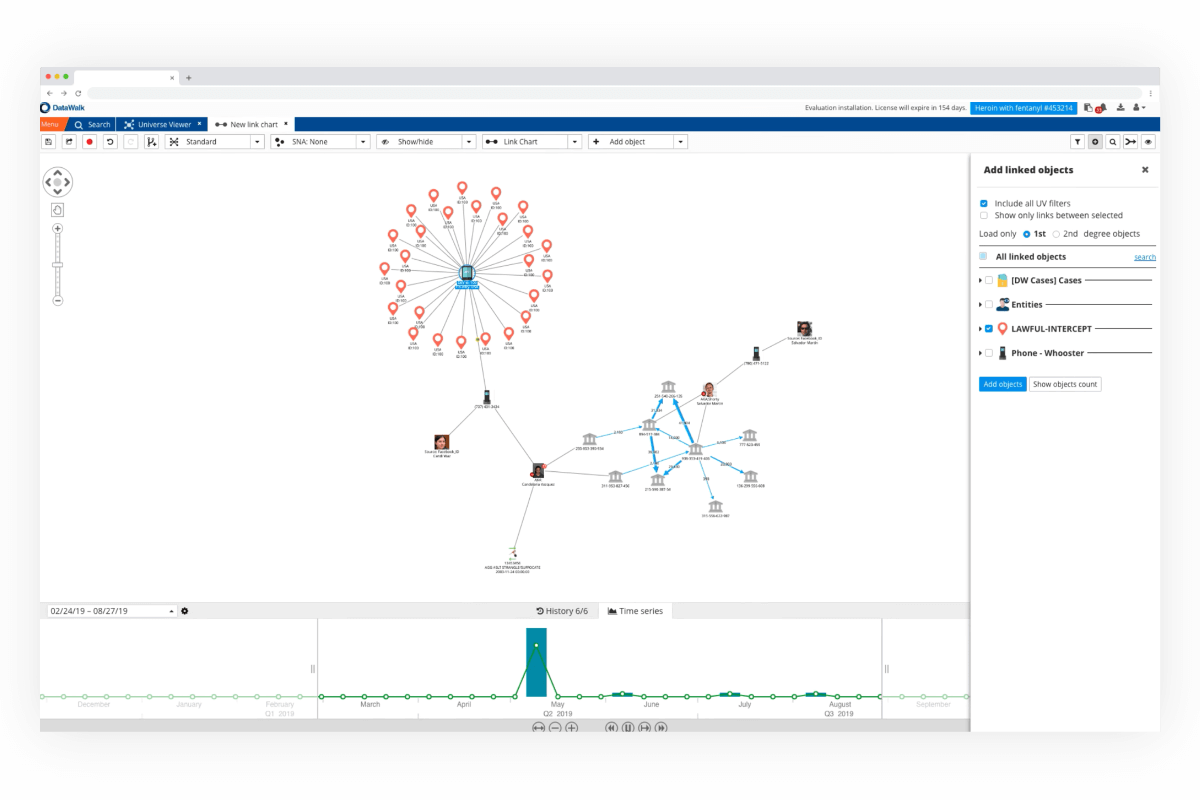
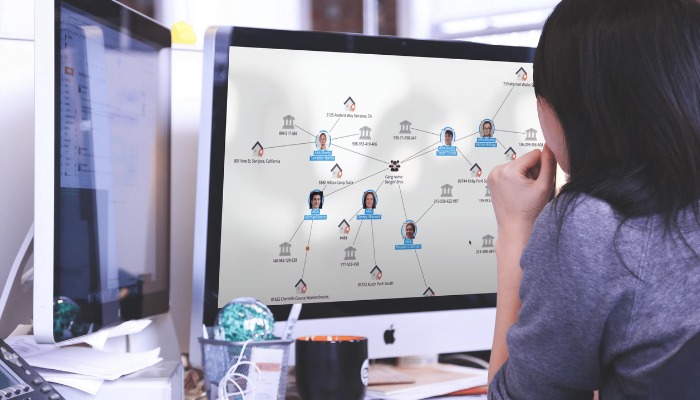
Instantly Identify Distant Connections and Organized Crime Groups
DataWalk graph algorithms enable you to perform various relationship-based analyses across all your data at the push of a button. Users can explore connected components, page rank, closeness centrality, and betweenness centrality with ease. For example, you can automatically find the shortest paths between distant entities or use weakly connected components to automatically identify clusters that have the characteristics of organized crime groups or other networks of interest. Without these algorithms, deriving such results could otherwise take days or months.
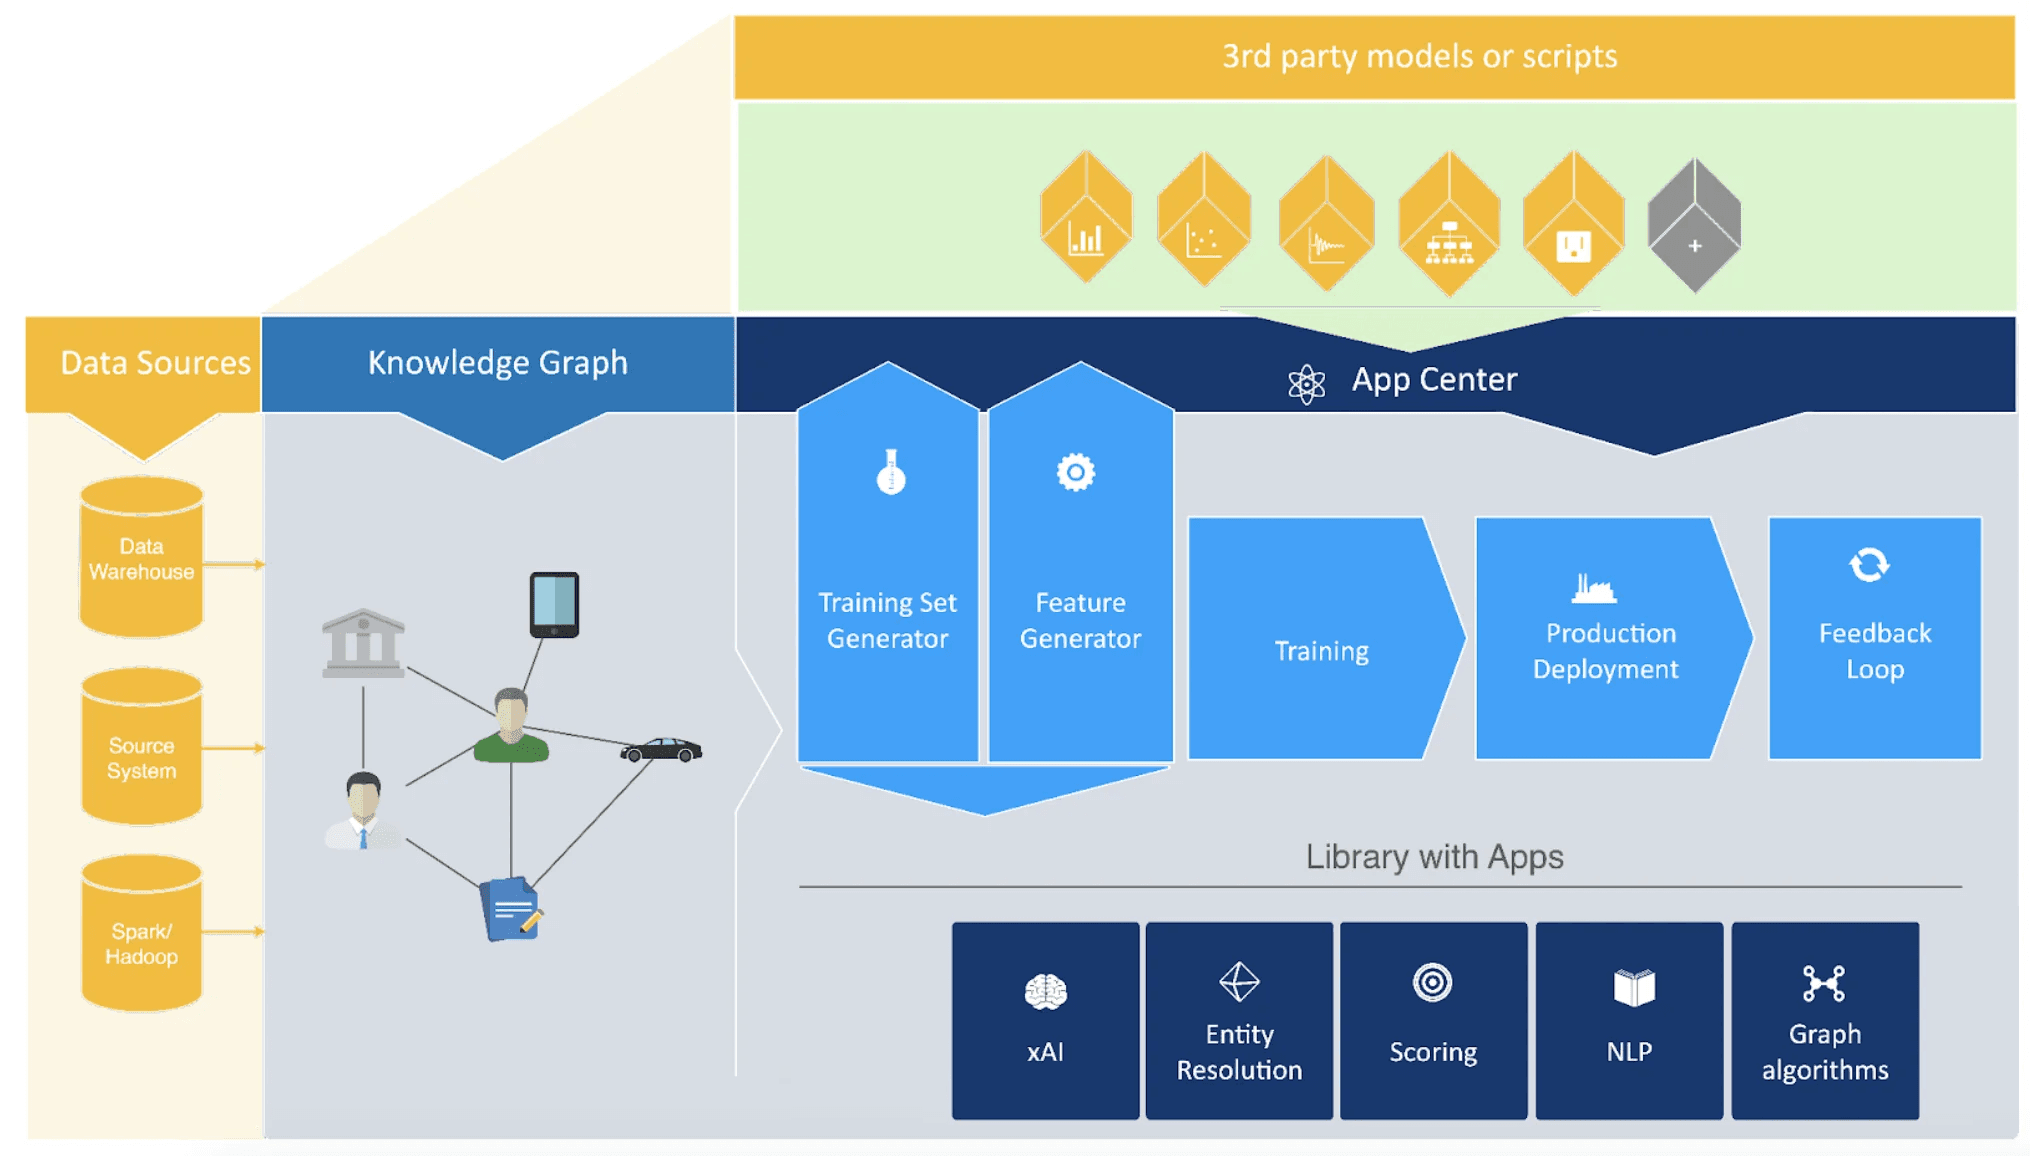
Efficient Artificial Intelligence (AI)
DataWalk AI graph analysis improves the process for creating efficient machine learning (ML), explainable artificial intelligence (XAI), and other types of AI solutions. Graph analysis enables data scientists and data engineers to create a richer set of features and training sets based on relationships between data points. Embedded xAI engine enable data scientists and analysts to automate the generation and explanation of machine learning models. All ML models can be developed with real data and then be instantly deployed in production without re-coding. With DataWalk's machine learning capabilities, data scientists, data engineers, and developers can create graph embeddings and enriched training datasets by leveraging relationships in the data. Additionally, the platform streamlines the entire ML deployment cycle, enabling faster generation of results.
No Need To Develop New Graph Competencies
DataWalk provides ad-hoc, no-code facilities for both querying and graph algorithms, such that users do not need to learn a new programming language or otherwise develop new expertise in graph technology. This addresses a common barrier to adopting data graph analysis and lets organizations use graph analysis tools without the need for extensive re-training.