Detecting Organized Health Insurance Fraud: A Data-Driven Approach

About the Author
Piotr Kramek, specializes in leveraging advanced analytical platforms to combat complex financial crimes, particularly organized fraud. His expertise lies in unifying disparate datasets and applying visual and geospatial analysis to uncover hidden networks and accelerate investigations.Health insurance fraud is a multi-billion dollar problem for the industry, frequently executed by sophisticated, organized networks that are difficult to uncover using traditional methods. DataWalk provides a powerful analytical platform that unifies disparate datasets, enabling investigators to rapidly detect complex fraud patterns. By leveraging visual queries, advanced filtering, and integrated intelligence, organizations can effectively identify these criminal networks.
Why is organized health insurance fraud so difficult to detect?
Detecting health insurance fraud is challenging because it often involves complex, collusive schemes spanning multiple entities, including medical providers, clinics, and patients. These organized crime networks intentionally create convoluted webs of transactions and relationships to obscure their activities. Investigators must analyze vast and siloed datasets-such as National Provider Identifier (NPI) registries, billing records, and external intelligence like NICB alerts-which makes it nearly impossible to see the complete picture with conventional tools.
How does DataWalk unify disparate data for fraud investigations?
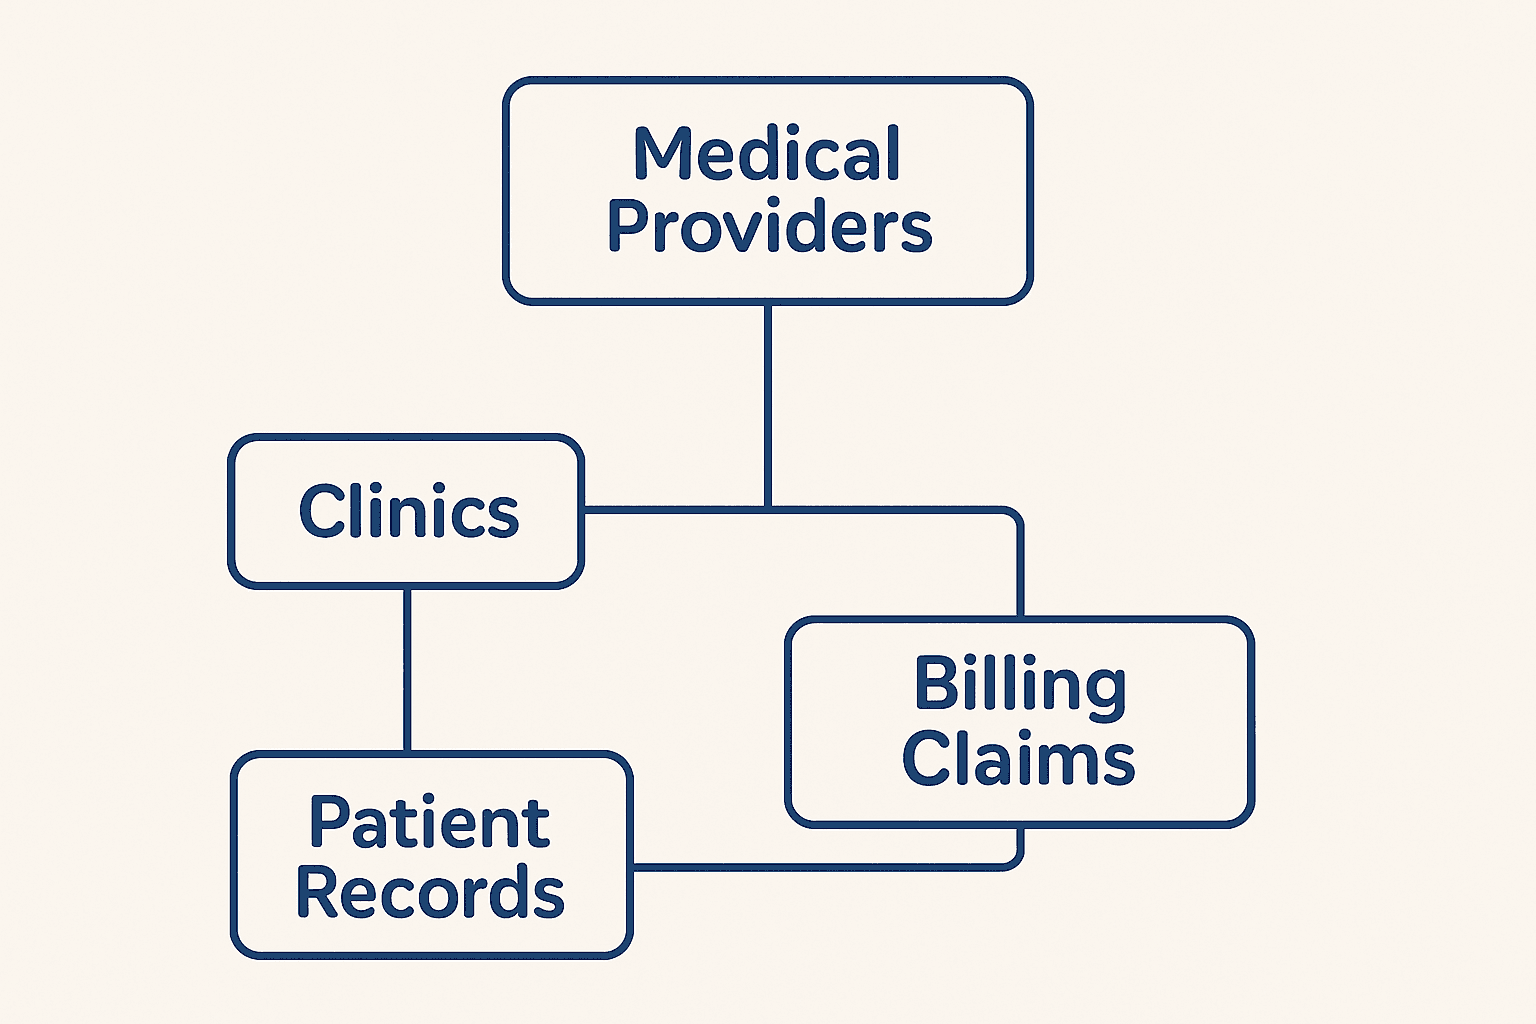
DataWalk eliminates the limitations of data silos by integrating all relevant information into a single, cohesive analytical environment. The platform's Universe Viewer provides a visual model of all connected data sources, organized around key entities like providers, clinics, patients, and claims. This allows investigators to see how different pieces of information relate to one another without needing to perform complex database joins or data preparation.
By consolidating NPI data, billing histories, public medical registries, and other sources, analysts can conduct comprehensive, cross-functional analysis. This unified view is the foundation for uncovering the subtle patterns and hidden connections that characterize sophisticated fraud schemes. For more information on our approach, see our fraud detection software solution page.
By consolidating NPI data, billing histories, public medical registries, and other sources, analysts can conduct comprehensive, cross-functional analysis. This unified view is the foundation for uncovering the subtle patterns and hidden connections that characterize sophisticated fraud schemes. For more information on our approach, see our fraud detection software solution page.
What analytical techniques can identify suspicious provider activity?
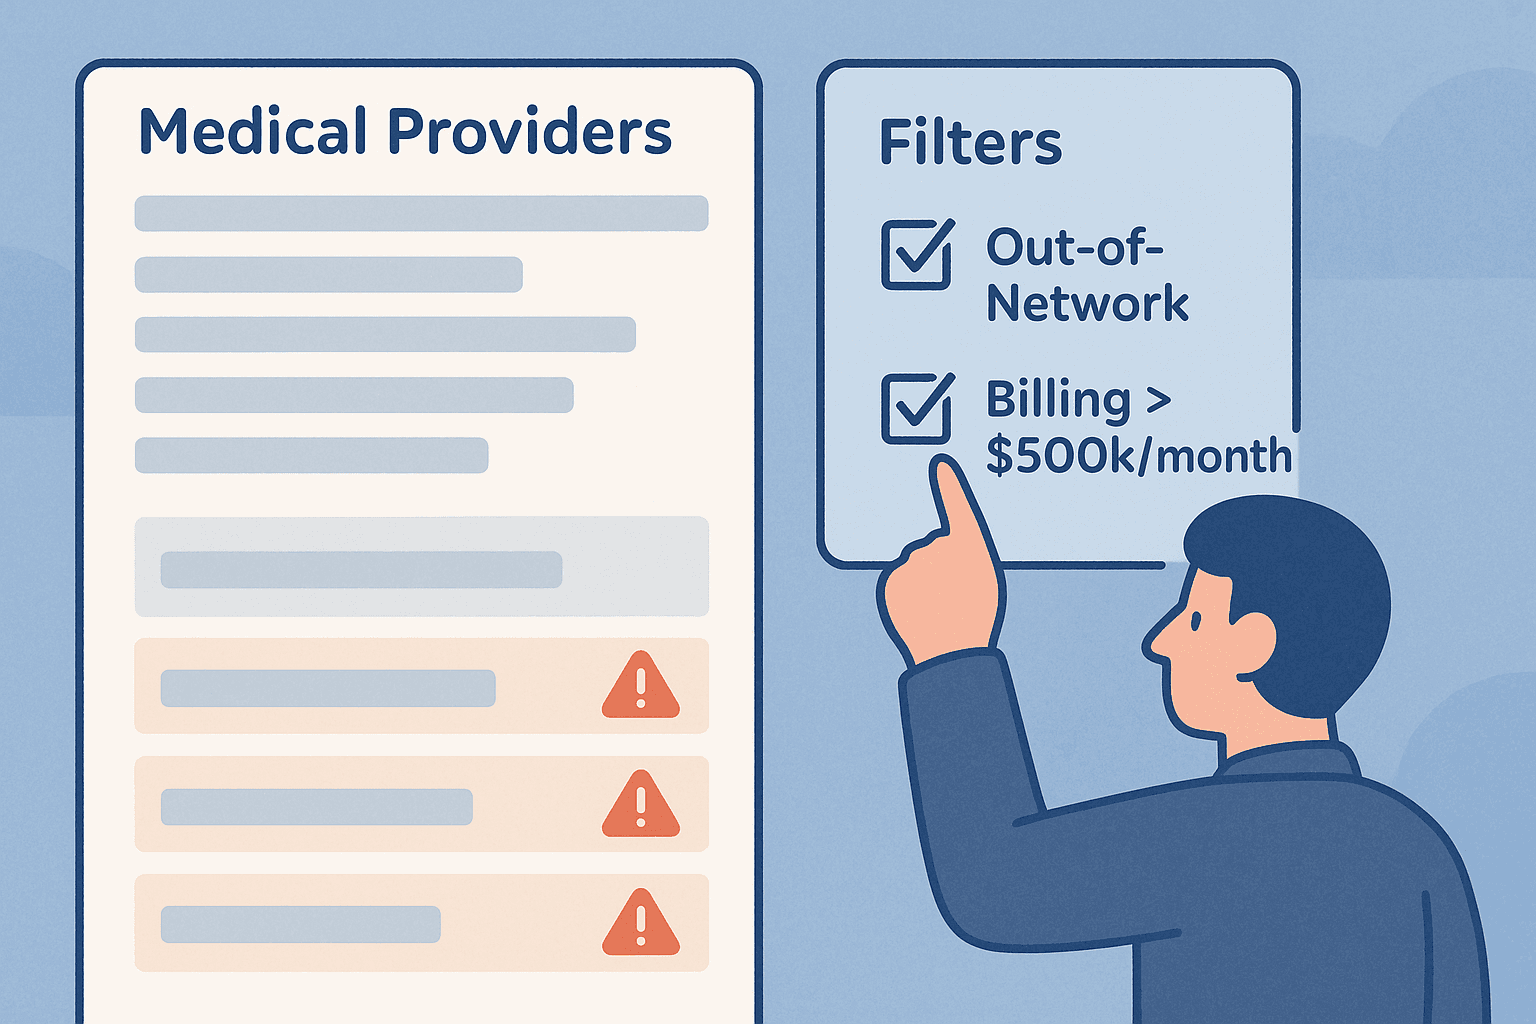
Once data is unified, DataWalk empowers investigators with powerful tools to isolate suspicious behavior. Users can perform complex visual queries directly on a knowledge graph to filter and segment data with ease. For instance, an analyst can instantly filter out all known, vetted medical providers to focus exclusively on out-of-network clinics that exhibit high-volume billing, a common red flag for fraud.
Furthermore, DataWalk's drag-and-drop import feature allows for the seamless integration of external intelligence, such as NICB alerts. An investigator can upload a list of flagged clinics and immediately see if any of them exist within their dataset, instantly connecting external alerts to internal billing activity. This capability transforms raw data into actionable intelligence, dramatically accelerating the investigative process.
Furthermore, DataWalk's drag-and-drop import feature allows for the seamless integration of external intelligence, such as NICB alerts. An investigator can upload a list of flagged clinics and immediately see if any of them exist within their dataset, instantly connecting external alerts to internal billing activity. This capability transforms raw data into actionable intelligence, dramatically accelerating the investigative process.
How does graph technology accelerate the discovery of fraud networks?
DataWalk transforms complex data into intuitive visualizations that make criminal structures clear at a glance. Instead of reviewing spreadsheets, investigators can generate instant link charts to map out the relationships between suspicious providers, clinics, and shared patients. This visual approach immediately reveals the structure of a fraud ring, highlighting key players and hidden connections that would otherwise be missed.
DataWalk then goes far beyond basic link analysis with unique technology that enables the rapid execution of graph algorithms across vast amounts of complex data. For example, DataWalk’s clustering facility enables automatic detection of suspicious networks, providing insights and leads on organized crime groups which otherwise may be impractical to find.
In addition to network diagrams, the platform can generate geographical heatmaps to reveal spatial patterns. By plotting the locations of suspicious clinics or patient addresses, investigators can identify geographic clusters of fraudulent activity, which is often indicative of a coordinated, organized scheme. This combination of powerful link analysis and geospatial visualization provides undeniable evidence and directs investigative resources with precision.
Frequently Asked Questions
What makes organized health insurance fraud so costly?
Organized fraud involves collusive networks of providers and clinics that systematically submit false or inflated claims, often on a massive scale. Unlike opportunistic, one-off fraud, these schemes are designed for high-volume, long-term criminal profit, leading to billions of dollars in losses annually.
What is the DataWalk Universe Viewer?
The Universe Viewer is DataWalk's knowledge graph - a visual interface for modeling and querying all connected data. It represents different datasets (like providers, claims, and alerts) as interconnected entities, allowing analysts to intuitively understand and query complex relationships without writing code.
How does DataWalk help investigators use external data like NICB alerts?
DataWalk allows for the simple drag-and-drop import of external intelligence files, such as alerts from the National Insurance Crime Bureau (NICB). The platform can instantly cross-reference this information against existing data to flag any providers or clinics that have been identified in suspicious activity reports.
Can DataWalk identify geographic concentrations of fraud?
Yes. DataWalk can generate geographical heatmaps based on any location data, such as clinic addresses or patient residences. This visualization quickly reveals geographic hotspots where fraudulent activity is concentrated, helping to identify organized, localized schemes.
What is a "visual query" in DataWalk?
A visual query allows an analyst to filter and analyze data by directly interacting with the Universe Viewer knowledge graph, rather than writing code. For example, an analyst can click to select certain types of providers and apply filters from a menu to immediately isolate a specific subset of data for investigation.
How do link charts help in fraud investigations?
Link charts are network diagrams that visually map the connections between different entities. In fraud investigations, they can instantly reveal the structure of a criminal network by showing how suspicious doctors, clinics, and patients are interconnected, making complex schemes easy to understand.
Solutions
Product
Partners
Company
Resources
Quick Links