

Skip to content
Graph traversal benchmark

Hop count alone tells you little about how a graph platform performs.

Starting from one account, how many accounts can you reach by following outgoing payments up to 12 transfers deep within a set date window? How long does it take to find them?

On a 20 TB dataset, DataWalk built and counted a set of 5.37 million connected accounts in 0.57 seconds.

Get the technical benchmark report Open PDF

Expanding the field of viewConcentric rings mark steps out from one account. Rules and alerts see only the first four steps, where the trail looks like a dead end. As the field of view widens to ten or more steps, the same trail leads through a ring of accounts to a suspicious account. 12345678910+12345678910+RingSuspiciousaccountFieldof viewWhere rules andalerts stopSteps →
0.57 sTime to build and count the set of 5.37 million accounts reached by following payments up to 12 transfers deep on 20 TB.
13×Transaction history grew from 1.5 TB to 20 TB. All three dataset sizes ran on the same six-server configuration.
About 1/8The six servers had about 2.5 TB of installed RAM, roughly one-eighth of the 20 TB dataset size.
~600M/sRelationship checks per second. The full sweep reached 50 million accounts and evaluated 37.15 billion relationship rows in 61.60 seconds.

DataWalk-run benchmark on synthetic banking data. One user, warmed local storage. Timings are server-side medians of ten runs.

“We built DataWalk for the questions you can't anticipate. Serious analytical power, a fraction of the memory footprint, and no special tuning to get there.”

Krystian Piećko — Chief Technology Officer, DataWalk
The challenge

Not all graph questions are created equal.

Graph benchmarks usually boast “N hops in X seconds.” But hop count hides the real cost. Two questions can go equally deep while exploring vastly different numbers of connections.

The challenge isn't simply going deeper. It's handling the explosion of connections at each step and the resulting performance hit, without forcing analysts to restrict their investigation.

Seven steps. Two very different workloads.

Same 20 TB dataset. Same starting account. Same directions. Only the date window changes.

Set date window 1.19M Accounts reached 0.44 seconds
All transaction history 50M Accounts reached 61.60 seconds
02 / What the benchmark shows

Ask the next question while it still matters.

01

Speed where investigators work.

Following payments from one account within a set date window, DataWalk reached 5.37 million connected accounts in 0.57 seconds on the 20 TB graph. Analysts can chase unexpected connections while the question is still fresh, rather than turning every follow-up into a batch job.

Proof: 5.37 million accounts in 0.57 s. 45.6 million in 5.34 s.

02

Same depth. Different workload.

Direction, time window and which records you continue exploring determine how much work a question requires. They also determine what the answer contains. Analysts can follow the evidence they need, rather than work around the limits of their tools.

Proof: Same seven steps. 0.44 s or 61.60 s, depending on the period.

03

Twice the data. Same answer time.

The 10 TB and 20 TB graphs contain the same 50 million accounts. Scoped questions reached identical accounts at both sizes in roughly the same time, despite twice the transaction history. The whole-history sweep took 1.6 times as long because it checked twice as many transactions.

Proof: 11 steps: 0.37 s at 10 TB, 0.31 s at 20 TB. At 15 steps: 4.59 s and 5.34 s.

03 / What makes DataWalk different

Built to do more with each question.

DataWalk prepares relationships as data is loaded, works across sets of connected records, and doesn't require the entire graph to fit in RAM. Less time reconstructing connections, less memory pressure, and more freedom to follow the evidence wherever it leads.

Follow relationships without rebuilding them.

In systems that assemble relationships at query time, each new question can mean more joins, more processing and more waiting.

DataWalk binds incoming data to a shared business ontology and creates defined relationships as the data is loaded. This upfront preparation optimises query execution at runtime.

Analysts can follow new leads without waiting for relationships to be rebuilt.

Follow populations, not just paths.

Some approaches work through individual paths or require analysts to rebuild their selections as they move between tools.

DataWalk's Set Traversal Framework works across entire groups of connected records, carrying the results, filters and analytical context from one step to the next and across views.

Analysts can change direction, narrow the population or pursue a new lead without starting over.

Go beyond the limits of RAM.

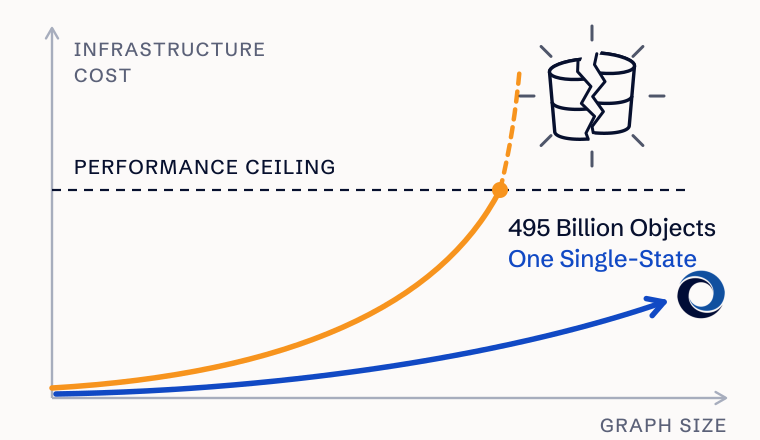
Memory-dependent graph engines can hit a ceiling when the graph outgrows available RAM, forcing larger infrastructure or changes to the workload.

DataWalk uses compact indexes and set operations, reading graph data from storage rather than requiring the entire graph in memory.

The result is more data available for investigation without RAM capacity growing in lockstep. In the benchmark, 20 TB ran on six servers with approximately 2.5 TB of installed RAM.

04 / Explore the evidence

How to compare graph benchmark claims

Give each system the same investigative task and agree on the expected answer before you compare results.

How was the DataWalk benchmark conducted?

Each dataset (1.5, 10 and 20 TB) ran on a separate, identically specified six-server cluster. The DataWalk build, storage class and workload settings were held constant. Transaction history increased while the traversable population remained at 50 million internal accounts.

No benchmark-specific tuning. Same configuration at every size.

Test conditions and methodology

  • Ten repetitions per measurement, reporting the server-side median.
  • One simulated user on a synthetic banking model.
  • Warmed node-local storage.
  • Timings cover building and counting the connected set, excluding client record retrieval and application rendering.
  • Every measured request completed within the 12 GB per-query allowance. This is an allowance, not measured peak memory usage.
  • No concurrent-user testing, independent audit or comparison with other products.
Another benchmark reports 16 hops. What should I ask?

15 hops isn't a DataWalk limit and hop count alone tells you little about the work involved. The benchmark was designed to test the work performed during traversal, not the maximum depth a system can reach.

Start by asking what the competing test was designed to measure. Then compare how many records were explored, which relationships qualified, and what the query returned.

Did the date filter make the result faster?

It reduced the work and changed the answer. A recent date window leaves out payments and may leave out accounts reached through those payments. To compare systems, use the same window, direction, starting records and expected result.

Could I run the same traversal in SQL?

Yes. Repeated joins can follow the same payment trail. Compare the time and resources required to produce the same result. Then try the next investigative question, such as reversing direction or changing dates, and compare the steps an analyst takes to ask it.

How can I compare timing and hardware fairly?

Record the hardware, installed memory, per-query allowances, tuning, storage warm-up and concurrent load. Match what the clock includes, such as a server-side count or opening results on screen. Ask for the median and the slower runs on broad requests as well as selective ones.

Read the benchmark measurements

The technical report gives the query definitions, test configuration and measurements at every reported depth.