Graph Analytics: The New Game-Changer For Anti-Fraud
whitepaper
Executive Summary
Combating fraud is fundamentally about a compromise between being competitive, having operational excellence, and being safe. The way we sell and deliver products and services generates a certain level of risk. If we require less paper, fewer confirmations, fewer clicks, and zero unnecessary additional actions from our customers or employees then we consciously generate a bigger exposure to fraud. Turing this around, when we are over-regulated, our procedures and processes are long and complex and then we are less competitive. So, the key is to find a saddle point which technically means the utilization of all existing possibilities instead of impacting and changing existing business processes.
That is the reason why the Holy Grail for combating fraud is maximizing the value from existing, but often unused data and to use all available techniques seeking to improve the accuracy of detecting crimes and to speed up the examination process.
Graph technologies are game-changers in this fight of combating fraud. Gartner Group lists “graph” as one of the industry’s key trends and has stated that graph analytics is critical for understanding misbehavior[1] and expanding the context for analysis. Graphs fundamentally change how we use and interact with data, enabling us to expand and understand the context extracted from the relationships between entities, places, accounts, and so forth. Graph is used for:
- Fraud detection and investigations
- Financial crimes 360
- AML alerting and investigations
- Dramatic reduction of AML false positives
- 360-degree KYC analysis
- Customer Due Diligence
- AI/Machine Learning
- Other non-investigative sorts of applications
Graph extends data discovery capabilities, enriching information and going far beyond what is possible with conventional technologies. This can significantly reduce false positives and significantly increase the accuracy of fraud detection tools.
Conventional analytics technologies utilized by traditional detection systems store and display data in tables or charts. Graph technologies complement such systems by identifying and analyzing the relationships and connections among the data elements.
According to Gartner’s research, only 10% of innovative projects currently use graph technologies, but this will rise significantly to 80% in 2025[2]. According to this forecast, most enterprise organizations will become users of graph in the coming years regardless of their core area of focus. Organizations who more aggressively adopt graph technology can reduce costs, improve compliance, better protect their company, and gain competitive advantage.
Graph: A Quick Introduction
While traditional systems focus on storing and analyzing values, graph technology identifies and analyzes the connections and relationships between data objects providing additional insights for further analysis.
With traditional analysis, things like basic aggregated information on the number of transactions for a specific bank account are commonplace. With a graph, it’s easy to derive information whether that account transacted with other accounts of interest, or if any customer is directly or indirectly connected to a suspicious person, company, IP address, phone number, or anything else.
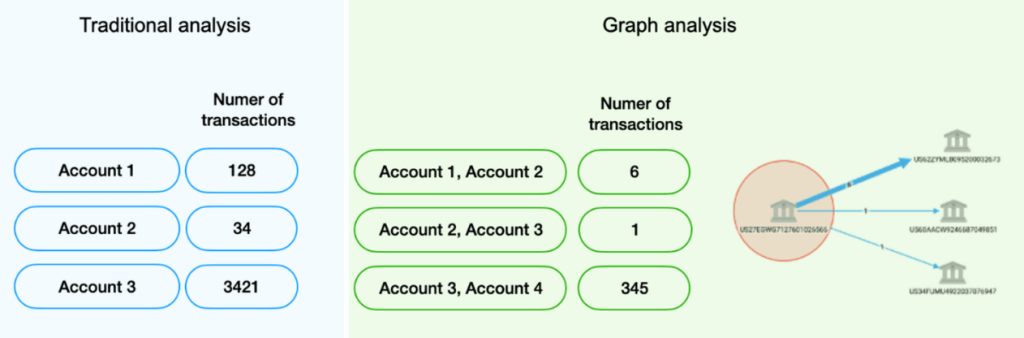
Figure 1. Comparing traditional table-based data to graph analysis
To many, “graph” may simply imply visualizations like bar charts or line charts. However, the network graphs referred to in this document are very different. Figure 1 below shows a simple graph, visualizing data elements and their relationships.

Figure 2. Network graph is very different than traditional charts.
Graph naturally leads us to the term graph analytics; a set of techniques and capabilities to help discover new patterns and trends. The table below describes several types of graph analytics:
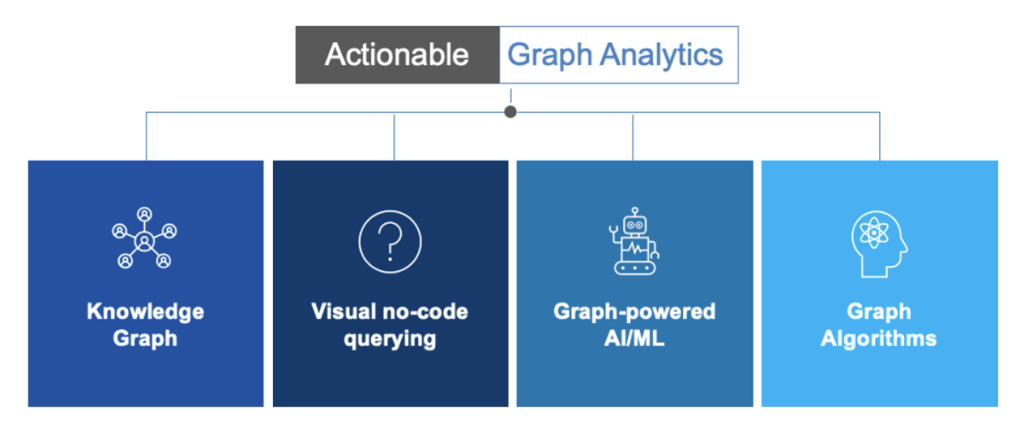
Figure 3. Types of graph analytics

Ineffective anti-fraud systems
Let’s answer a critical question: why aren‘t existing anti-fraud systems sufficiently effective?
Generally, we can divide this issue into various categories:
- “Data lens” problems – Several years ago, to build a digital representation of a customer, you'd use maybe 50 attributes stored in 3-5 data sources, including PII data, some KYC data, and maybe products/services used. Doing the same today might take over 500 attributes stored in dozens of silo'd sources, including mobile app logs, leaked-databases (e.g., Pandora Papers, Panama Papers), social media, open-source data, customer segmentation, and so forth. Most of those because of their complexity are not used at all as effectively finding false-positives or false-negatives hidden deep inside an intricate network of data sources is time-consuming and often impractical.
Using conventional technologies, generic filters and static reports are often applied against the data, which limits the ability to understand the intricate relationships among people, businesses, roles, accounts, phones, addresses, IPs, and other entities. Without the full context, detection and monitoring systems may either recognize innocent customers as being suspicious, or miss activities that truly are suspicious. It is easy to miss important insights about a customer or counterparties without using a broader lens, i.e., data from other company systems and external sources. For example, the monitoring system won't generate an alert for multiple invoices issued by different vendors under the same RFP. However, investigators after a detailed examination may find that these businesses have common stakeholders and one of them share an address with the employee from a purchasing department. Lack of such existing context generates false positives and limits the ability to identify misbehaviors. - Data quality problems – Disparate silo'd data sources, data inconsistencies, varying formats, missing values, and duplicated data all negatively impact detection processes and cause a large number of false positives. To borrow a phrase from computer science, it’s "garbage in, garbage out," where “garbage” input data produces useless output regardless of the analytics used.
A complicating factor is that criminals may intentionally seek to change their personally identifiable information to try and outmaneuver investigators by changing a single letter or digit in names, addresses, or social security numbers. Using all customer data, buried in dozens of data silos, to identify duplicate records causes significant problems for legacy systems and existing analytical infrastructures. - Data analytics problems – Although the number of data sources and quantity of data has dramatically increased in recent years, the human capacity to understand and interpret results remains constant. From a technology perspective, a typical set of rules or vectors for detecting suspicious activities is relatively flat and has been a default approach for years. As data becomes more complicated and intertwined, traditional approaches using SQL queries to analyze data start to breakdown, can’t scale, or become too complex. In addition, anti-fraud organizations are given the erroneous choice between the usage of expert rules, machine learning or graph analytics, instead of using them all. In practice, this results in configuring conventional alerting/detecting systems to perform basic checks without verifying the entire existing context.
Example 1: A transaction by a high-risk customer previously alerted when the amount from the invoice exceeded the value from the contract, but that alert was later deemed not to be problematic. Then the alerting system will again flag as high risk a second similar transaction linked to the same contract, as that customer has multiple alerts. It does not consider that the previous alert was generated for the same reason for the same contract and was closed, indicating this transaction shouldn’t be alerted and instead should be flagged as low risk. This scenario is visualized in the network graph shown below.

Figure 4. High-risk customer and alert - false positives generated by conventional systems without using the connections context.
Example 2: The conventional alerting system cannot identify indirect, multiple-hop relationships that may indicate a suspicious transaction. This scenario is visualized on the network graph below.
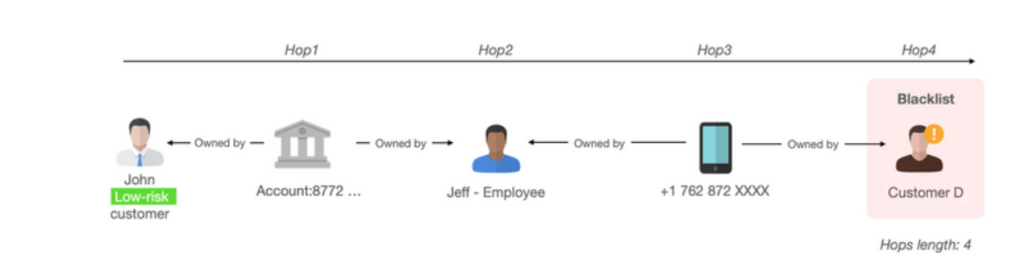
Figure 5. With conventional fraud tools a customer was marked as low-risk regardless of the fact that he is connected with a blacklisted customer.
Graph can significantly change the trajectory of today’s inefficient fight against money laundering and fraud.
Graph eliminates the problem of data silo’d
Graph technology is uniquely suited for being able to quickly integrate and link internal and external data, regardless of its complexity and size, through connections between business entities, processes, and events. A knowledge graph can potentially take this one step further, enabling you to re-organize the data not around data sources, but around relevant business objects such as customers, transactions, phone numbers, or anything else. This enables you to derive new insights and identify patterns from vast amounts of complex data. With graph analytics, customers can easily combine fraud data, CRM, ERP data, AML data, cyber security data, external data such as public records services (e.g., Thomson Reuters CLEAR, Pipl.com, HaveIbeenpwned.com) or offshore leaks databases (e.g., Pandora, Panama Papers) and seamlessly uncover tacit knowledge from the connections and relationships. Systems like DataWalk generate and save all of these connections, to assure all customer data is pre-connected and ready to use. With graph, all relevant information can be delivered on a single pane of glass, eliminate data fragmentation problems and dramatically accelerate the triage process.
Graph improves data quality
Graph technology is an excellent fit for entity resolution for key attributes such as names, addresses, phone numbers, bank accounts, and identification numbers. Using techniques such as graph-based expert rules or advanced fuzzy matching, graph technologies support quick identification and merging of possible matches or duplicates at scale. Once found, graph algorithms (e.g., page rank) can determine which entity should be dominant considering the number of existing interactions compared to others. In addition, graph is well-suited to track the lineage of all entities, and data transformations become fully transparent and explainable for non-technical users.
Example 3: Entity resolution graph visualization. With graph you can group alerts having a single analyst manage them at once, contextually not separately. This will accelerate the triage process.
The network graph below presents four entities matched using various fuzzy techniques such as Eudex, Soundex, Double Metaphone, etc. Graph technology can provide full transparency and explanation of what techniques have been applied to match records.
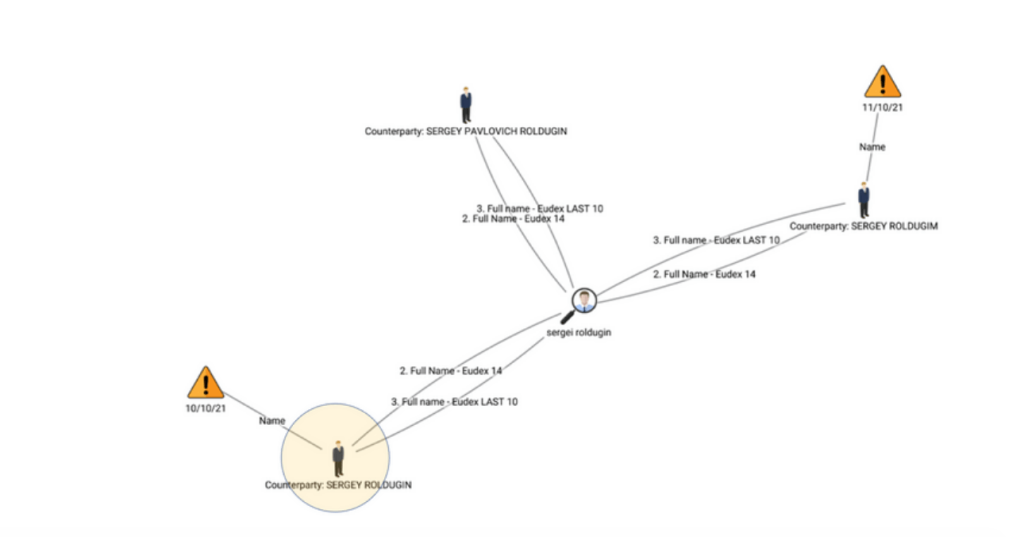
Figure 6. Matching entities on a network graph
Graph powers data analytics
Graph analytics are uniquely suited to expose anomalies in large and/or complex datasets. Further, graph can power other types of analysis such as expert rules and AI/machine learning, providing sophisticated contextual insight derived from relationships.
Some graphs provide a knowledge graph for interacting with “graph” data. Knowledge graphs vary in their nature and available facilities, but generally they provide a streamlined view of large amounts of complex data in a simple visual interface oriented around understandable business objects such as people, accounts, SARs, claims, invoices, transactions, and anything else. This aligns the analysis with the way people think instead of exploring data with complicated technical constructs.

Figure 7. Example of a knowledge graph for an enterprise organization – Fraud 360°
Graphs have the unique ability to quickly provide answers such as which objects are connected and how. Graph algorithms, which as the name suggests are algorithms used specifically to analyze graph data, leverage this connectivity, uncovering hidden conditions such as:
- one SSN used by multiple people
- multiple SSNs used by the same person
- multiple SSNs shared by different people
- an address used by many people
- the same IP address used to access multiple accounts by unrelated people
- the distance between validated entity and fraudster is lower than 4 “hops”
Example 4: A graph algorithm called shortest path can automatically determine the shortest number of connections or hops between two objects in a graph. For example, we can specify if there are fewer than seven hops between a customer and an entity on a blacklist AND there is shared PII data and transactions made within 5 days, then mark that customer as high risk.
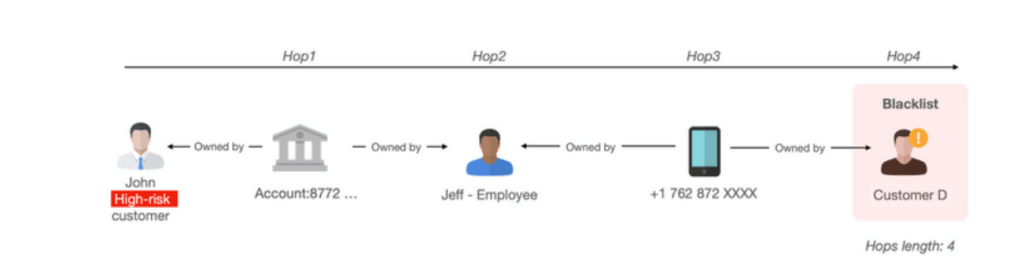
Figure 8. With graph-based solutions a customer was marked as a high-risk as he is connected with a blacklisted account and customer
Example 5: Consider a case where a previous alert (by a conventional alerting system) was generated for the same counterparty but was closed as a false positive; i.e., the contract has been changed but data is not updated and someone has already verified it. This results in lowering the risk for an alert/customer from high to low.

Figure 9. When analyzing the graph, a Customer / Vendor A was marked as low risk, taking into account the fact that the previous alert was marked as a false positive
Example 6: A graph algorithm called community analysis connects objects to known networks (also called clusters), such as an organized crime network. This is a very powerful capability, potentially enabling in minutes identification of a crime ring that otherwise may take days or weeks to identify manually. For the example below, customer and counterparties A and B and C will be marked as suspicious as they share common attributes and most importantly, counterparty B has used the same IP address as Customer D, which has been reported by a whistleblower.
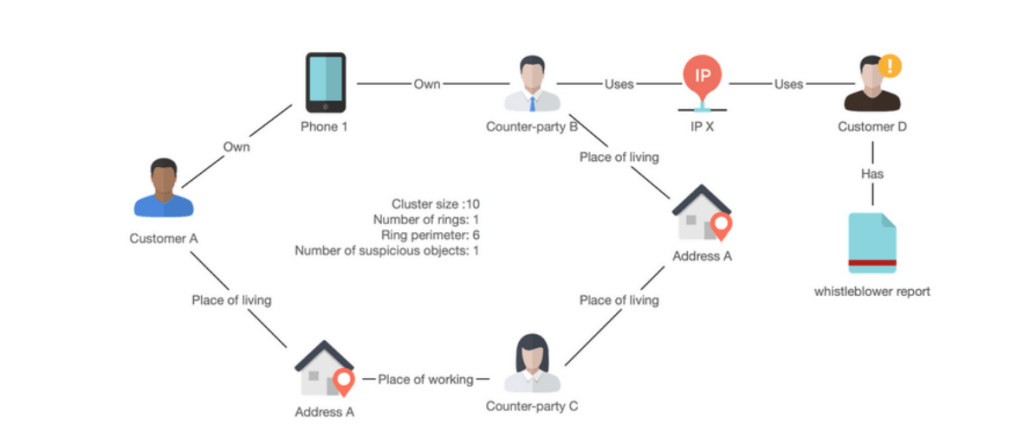
Figure 10. Graph algorithm (community detection) enables you to capture suspicious graph constructs (e.g., organized crime rings) describing them with variables such as cluster size, number of rings, perimeter, etc.
The unique insight from graph algorithms can be converted into rules or machine learning features in order to enhance predictive capabilities for reducing or eliminating false positives and identifying new suspicious schemes.
Following are examples of features that can be used for machine learning, or for generating graph-based rules:

Example rule: if the distance between object A and blacklisted objects is lower than six hops, AND the object A is a part of a suspicious cluster with at least one ring, then mark this object as high risk.
For today’s financial institutions, the channels of distribution/promotion, interactions with customers, and regulatory requirements can be highly complex. This results in a critical need to ask complex questions on complex structured and unstructured data, which is often impractical using conventional technologies such as SQL.

Figure 11. Visualization of a complex question
To help answer complex and ad-hoc questions, many use cases require graphs as an enabling technology. The ability to generate complex queries across all data supports quick verification of hypotheses and comprehensive examination of conventional rules to know which should potentially be tuned to reduce false positives.
In systems such as DataWalk, graph-based queries, also considered as analyses or rules, can be weighted and combined to create features for a score or for machine learning components. Powering machine learning with more data and insight from connections makes this sort of analysis more accurate and helps organizations determine which alerts are false and true positives.
The Bottom Line
Graph technology can provide new capabilities and compelling benefits to help organizations in eliminating frauds of a different nature. Companies that adopt this emerging technology will enjoy a competitive advantage over their peers.
About DataWalk
DataWalk is a scalable, no-code, graph analytics software platform. DataWalk’s graph analysis foundation enables you to connect all your data, understand structures, and identify patterns in large, highly connected datasets through an intuitive knowledge graph. This includes data import, data prep and linking, data exploration, data analysis (including machine learning) and data lineage. DataWalk effectively supplements case management and monitoring systems, weeding out false positives and improving the number of successful escalations.
To learn more visit: https://datawalk.com/anti-fraud-software/
---
[1] “Connecting the Dots: Why Graph Analytics Are Key to Understanding Human and Machine Misbehavior,” by Jim Hare, Gartner Group.
[2] Source: https://www.gartner.com/en/newsroom/press-releases/2021-03-16-gartner-identifies-top-10-data-and-analytics-technologies-trends-for-2021

Register to Get PDF
Solutions
Product
Partners
Company
Resources
Quick Links