Network Graph Software: What It Is, When To Use It, And The DataWalk Solution
What is Network Graph Software?
Network Graph software, as included in DataWalk, enables you to visualize and analyze the relationships between entities, where an entity may be a person, an event, a transaction, a vehicle, or anything else. Entities are represented as nodes, and the relationships between entities are represented as lines that are called links or connections.
What’s Good About Network Graphs?
Network graphs are intuitive visualizations of relationships. Such relationships are very awkward to show with traditional tables or bar charts, and similarly can be awkward to store and analyze using traditional technologies. Network graph software is optimized specifically for the display and analysis of networks, i.e., nodes and connections.
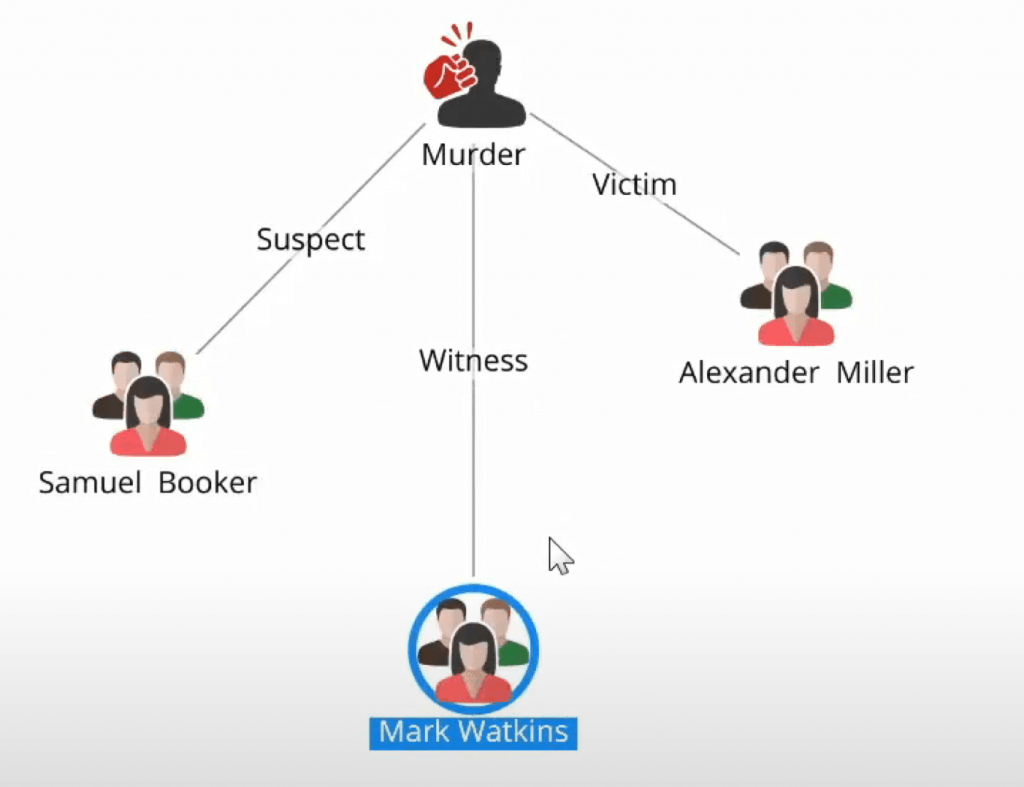
Network Graph Example
Below is an example of a network graph for a fictitious law enforcement use case. In this case, the network graph visualizes how several people relate to a crime, specifically that Alexander Miller was murdered, Mark Watkins witnessed the crime, and Samuel Booker is a suspect.
Network Graph Software: Who Needs It
A network graph is an excellent construct if your key questions are around identifying and understanding how and whether entities are connected.
Graph network analysis is extremely useful in intelligence analysis (e.g., one person is an associate of a suspect or known criminal), fraud detection (e.g., the same social security number was used by different people), social network analysis (who are my friends and other connections), and many others.
Network Graph Software: The DataWalk Solution
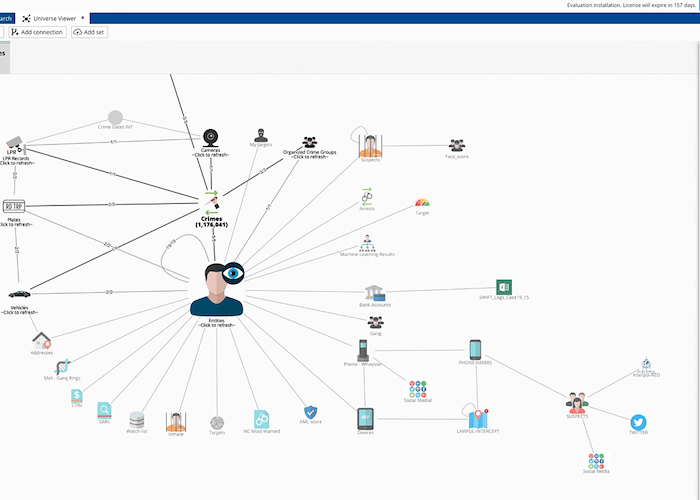
DataWalk is a comprehensive Enterprise-class software platform for fusing data across your various sources, and then enabling easy access and analysis of that data through a variety of analytic approaches. Graph analysis is just one of those approaches. In DataWalk we typically refer to network graph analysis as link analysis, and you can learn more about the DataWalk link analysis solution.
DataWalk heavily utilizes graph technology as a foundational element of the system, and provides a robust facility for visualizing and analyzing network graphs. The DataWalk network graph facility provides the ability to merge entities; save, share, and retrieve link charts; generate alerts; undo/redo previous steps of an analysis; display entities on integrated maps; create heatmaps; and automatically identify important entities in a network graph via Social Network Analysis. DataWalk’s unique technology enables rapid execution of graph algorithms, such as the ability to identify whether two objects may be “distantly connected” via a number of other nodes, the ability to automatically identify clusters of a specific pattern (e.g., an organized crime group), and many others.
FYI, note that related terminology can get confusing. A network graph may also be known as a link chart, a node-link diagram, a network map, a network visualization, or just a “graph”. Simply drawing a network graph may be referred to as graph visualization. Analysis of a network graph is known as graph analysis, link analysis, and network analysis. Links between entities are often referred to as connections. Experts and academics typically refer to nodes as vertices, and refer to links as edges.